
Searching For Santa
December 27, 2012Here We Go Again
March 28, 2013Equity markets have enjoyed a powerful start to 2013 as broad indexes like the S&P 500 have gapped higher right from the first minutes of trading. The crazed buying pressure was enough to mark the best January for the S&P since 1997. The gap in prices have some important historic implications for investors.
For investors, 2012 was a year of endless waiting; waiting for a resolution to the U.S. fiscal cliff, progress on the European debt crisis, results of a polarizing U.S. election, a Chinese leadership transition, resolution to the Bush tax cut extensions, etc..etc..etc. Any one of these issues alone possessed enough economic significance to bring investor confidence to a halt, and in 2012 investment decision makers faced all of them simultaneously. It's no wonder the indication of some resolution to these issues have stocks rallying in relief, leaving gaps in the charts in their wake.
Gaps: Emotional Decision Making
Gaps occur when a security’s opening price is significantly higher (or lower) than the previous day’s closing price. The effect leaves a void in prices where no trading occurred, or what’s referred to as a “gap” on the charts. Gaps represent emotionally charged investing usually the result of a surprise earnings release or news event investors had not previously accounted for. Gaps are most common with individual stocks and a rarity for broad market indexes like the S&P 500.
Typically gaps are filled within hours or days as cooler heads eventually prevail and sell prices back down to pre-euphoria levels. While most gaps are filled in short order, not all gaps are equal. Some gaps can lead to periods of sustained momentum indicating important market bottoms.
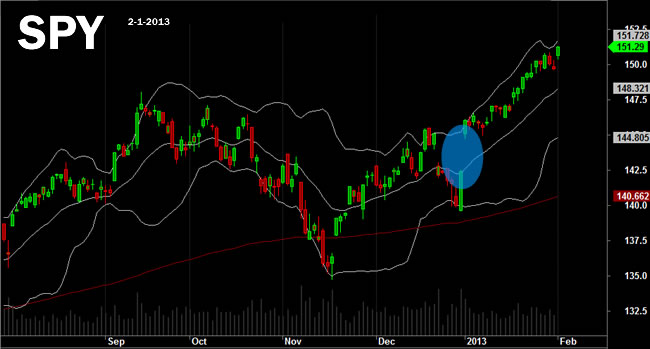
The January gap can be seen highlighted in blue on the chart below of SPY, an exchange traded fund that tracks the S&P 500 Index. Not only did SPY open trading more than 1% higher than the last price the previous day, it also gapped from the lower Bollinger Band to the upper band, another indication of the extremes in buying pressure.
Few Precedents
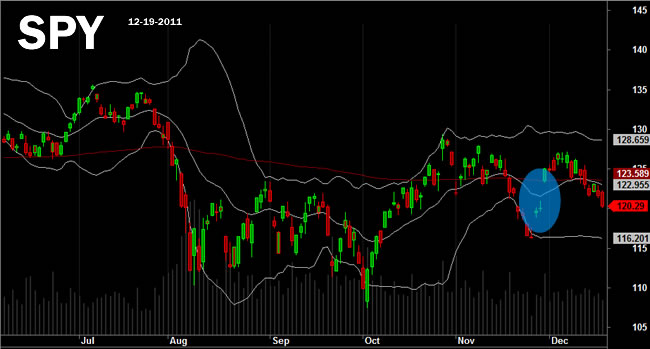
The January 2013 gap is nothing short of impressive. Going back to 1980 there are very few precedents for this kind of powerful surge in a broad index like the S&P 500 in a single day. One example occurs in late 2011. In November 2011 global equity markets were in free fall on fears over the European debt crisis. Several European banks were rumored to be only hours away from insolvency, fearing they would be unable to open their doors for business the next day. With the S&P 500 down nearly -7% for the month, investor panic had set in.
An announcement of global federal reserve intervention in dollar swaps and in the introduction of the European LTRO (Euro Quantitative Easing) sent the S&P 500 gapping higher in an impressive rally. However, even the November 2011 gap did not move all the way to it's upper Bollinger Band. As is typical, the November 2011 gap was filled a few sessions later as prices drifted back down in December.
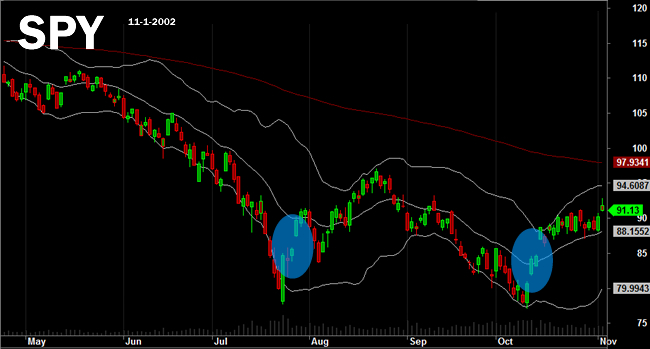
The only other instance similar to January's powerful gap higher occurred in the Bear Market of 2002. There were actually two significant gaps in the S&P in 2002, one in July and the other in October. The gap in July did not take prices from the lower band of recent trading to the high like the current climate, but the October rally did. As you can see from the chart below the July gap was filled by selling within days. However the momentum from the October gap carried the S&P 500 higher for 33 trading sessions before topping out on 12/2/2002. The gap was eventually filled some 74 days from the initial gap when SPY finally traded back to pre-euphoria levels on 1/30/2003.
Clear Thinking.
While the gap higher in equity markets has been exciting, the current pace of the S&P rally year-to-date is unsustainable without a pause, if not a short term correction. The S&P 500 Index tracking ETF:SPY has advanced +6.2% through 2/1/2013. The current pace in equities would represent an annualized return of 99.2%. Even the most wide eyed optimist will admit that a +100% year for broad equity markets would be a very low probability from here. In fact divergences are already forming that may be early indications of short term trouble for equities.
For the past several years Emerging Markets and High Yield Bonds have been some of the strongest performing asset classes, leading markets higher. Recently these leaders have quietly diverged from the S&P rally. While the S&P 500 has advanced 5% year-to-date through 2/4/2013, Emerging Market equities (represented by ETF:EEM) are now negative -0.9% for the year, while High Yield Bonds (represented by ETF: JNK) are now -0.4%.
The January gap and subsequent rally clearly illustrate the pent up investor frustration surrounding the uncertainty of 2012, providing an exciting start to 2013. The rally is now 24 sessions old and divergences are forming in leadership sectors.
Risk of a correction is clearly elevated.