
What The Fed is Watching
March 14, 2017Caution: You Are Here
January 29, 2018Well it's official, the lazy days of summer are over. The kids are back in school, Wall Street is back to work and Halloween decorations are already showing up in stores. Volatility in markets has returned, and our risk models are beginning to make adjustments to portfolios. September and October are notorious for some of the highest market volatility on record. Likewise, November and December have demonstrated strong bullish tendencies over the years. How are things sizing up for the rest of 2017? We have some insights, and it begins by understanding how we got here.
Let's Go Streaking.
Let's go all the way back to January when markets started off 2017 with a heavy dose of what we would describe as "Cautious Optimism". Cautious about a new administration and untested leader in President Trump, but optimistic about a business friendly agenda in tax reform and healthcare. In February we published a research post highlighting rare equity market behavior with highly bullish implications. You can read the When Equities Go Streaking full post here. The main point of the commentary was that when the S&P 500 goes 80 days or more without a 1% correction there is a high probability for continued gains, reminiscent of 1990's style momentum.
Since sharing our bullish observations in February, the S&P 500 Index has advanced another +5.7%, while the more growth oriented NASDAQ 100 Index has gained an additional 12.1%. Below is an update to the streaks data through 9/6/2017.
| START DATE | END DATE | % STREAK GAIN | TRADING DAYS | CORRECTION | CORRECTION DAYS | FOLLOWING RALLY | RALLY DAYS |
| 1/3/85 | 6/12/85 | 13.45% | 112 | -1.98% | 1 | 5.57% | 23 |
| 10/12/92 | 2/12/93 | 10.41% | 87 | -2.85% | 3 | 11.10% | 244 |
| 12/9/94 | 5/17/95 | 18.30% | 110 | -1.50% | 2 | 19.45% | 139 |
| 7/14/06 | 11/24/06 | 12.77% | 94 | -1.36% | 1 | 5.50% | 57 |
| 10/12/16 | 3/21/2017 | 11.08% | 110 | -1.24% | 1 | 5.7%* | 118* |
Record Bullishness
Just how consistent has this year's momentum been?
Here are a few of the records that are beginning to stack up:
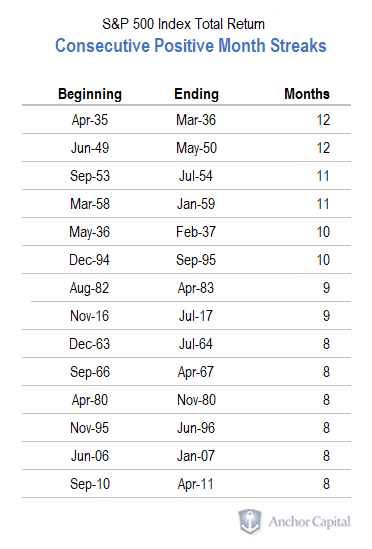
-The S&P 500 has not had a Negative Month Since October 2016, Longest Streak in 20 Years. CHART
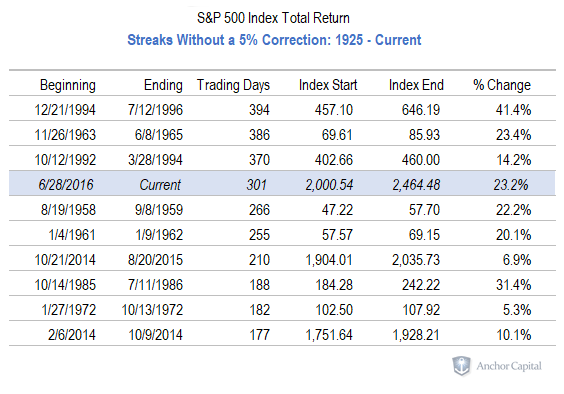
-The S&P 500 Index is Currently on it's 4th Longest Streak without a 5% Correction in History. CHART
-7 Of the 10 Lowest VIX Closes on Record Came in the Past 12 Months. CHART
So here we are, ten months into a powerful equity market rally that was born in the investor anxiousness surrounding the 2016 election. What a contrast to the year prior. The first six weeks of 2016 set a new record as the worst start to any year in the history of the stock market, even exceeding the declines of early 2008. In just twelve months equity markets have moved from high volatility and fear to a powerful rally and new all time highs, setting records low for volatility. The last 24 months are a prime example of why we utilize quantitative risk models to both seek opportunity and manage against downside risk. Despite investor nervousness over a number of headlines this year, our equity risk models have kept us invested in line with the rising price trends, with only a few days of hedging.
But things may be changing. Equity valuations are now nearing the levels seen at previous market tops in 2000 and 2008, and our short and intermediate term risk models are beginning to flash warning signs.
Expect Volatility. Expect Opportunity.
Volatility is mean reverting. Simply stated, there is no "average" volatility. It swings between extremes. Periods of relatively low volatility are always followed by periods of high volatility. As we go into September with record low VIX and new all time highs in many equity indexes, investors should expect volatility to rise. One doesn't need to look too far for a wide number of catalysts that may raise investor concern. Hurricanes, a highly charged Washington D.C. agenda and increasing threat of war from North Korea are just a few headlines we are sure to encounter. The bottom line is, expect larger reactions to short term headlines, both positive and negative.
For Anchor Capital strategies, increased volatility creates exciting opportunities as our models navigate the risk and opportunity. Whether the record positive momentum continues into the end of the year or markets crater, one thing is for sure: This is not the time to be without a disciplined risk management process.