NOT So Lazy Summer Days
July 31, 2011Warning Signs from High Yield Credit and International Markets
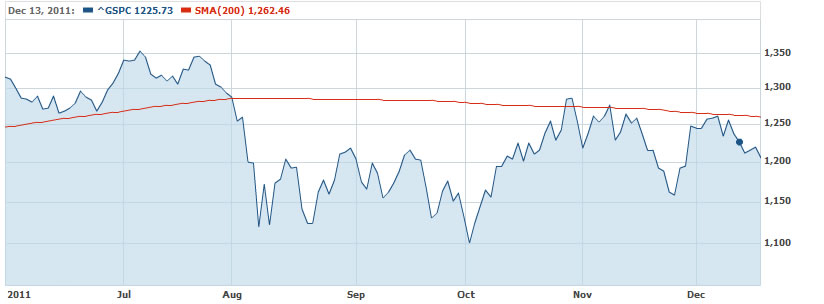
April 17, 2012In the past six months markets have had more ups and downs than a Shakespearean drama. Looking at the cumulative points traded on the S&P 500 regardless of advancing or declining days since June 1, the S&P has traveled a total of 2,383 points through December 20, 2011. That is more than double the value of the index! The entire value of the S&P 500 has experienced 200% turnover in just the last 6 months. And what do we have to show for it? A loss of -7.1% for the S&P since June 1.
A Flat 200 Day Average for U.S. Equities
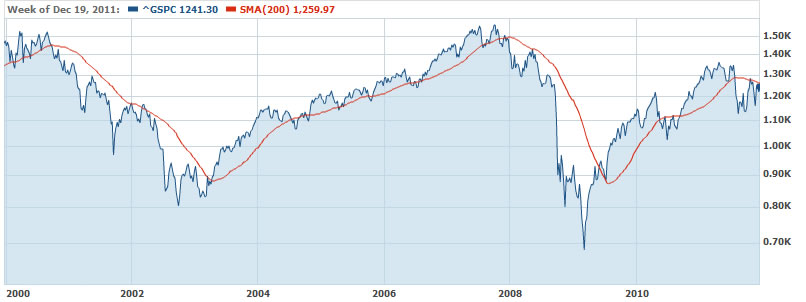
The lack of a discernible trend can be seen in the 200 day moving average. The 200 day average is widely accepted as a good indication of longer term market trends, and is illustrated in the chart of the S&P 500 below. Notice the clear rising and falling slope, regardless of Bull or Bear market.

Since June 1, the 200 day average is flat. And I don’t mean sideways, I mean absolutely zero, a pancake.

A Clear Downtrend in International markets.
While U.S. investors have been whipsawed violently up and down over the last 6 months, the trend in International markets has been nothing short of a waterfall. Our Global Long/Short equity strategy turned bearish on Non-U.S. equity indexes in early July, and continues to be negative today.
Since June 1 international equities have suffered in some cases three times the losses as the S&P. And it’s not just Europe. Broad declines in Asia and Latin America have underscored global equity declines. Below are some examples of country and regional ETF performance since June 1 through December 20, 2011:
| Europe | ||
| Germany | EWG | -29.1% |
| Italy | EWI | -35.6% |
| Spain | EWP | -30.3% |
| Asia | ||
| China | FXI | -22.8% |
| Hong Kong | EWH | -21.1% |
| Japan | EWJ | -12.0% |
| Malaysia | EWM | -13.3% |
| Americas | ||
| Canada | EWC | -22.1% |
| Brazil | EWZ | -23.5% |
| Mexico | EWW | -14.8% |
Opportunity Around the Corner
Investor indecision is running high with headlines creating euphoria and fear on a daily basis. The lack of trend, 200% turnover in the S&P and flat 200 day average are stark illustrations of just how confused markets have been. History has shown that periods of high volatility and whip saw markets are precursors of macro trend changes, and are often the birth pains of new more persistent trends. And for good reason. Long periods of sideways volatility creates pent up frustration for investors. Once a trend emerges, the inevitable "missing the boat" mentality takes over and investors rush into the new direction giving fuel and momentum to the new emerging trend.
U.S. markets are coiled right under the 200 day moving average once again, and look spring loaded for a large move. Whether down on more negative news from European banks or up on positive U.S. economic data, we see significant opportunities for Global Long/Short equity strategies over the next several quarters.
