Could a Fed Rate Cut Be Bearish?
June 13, 2019
LIQUIDITY DRAIN:THE RECORD DECLINE IN M2
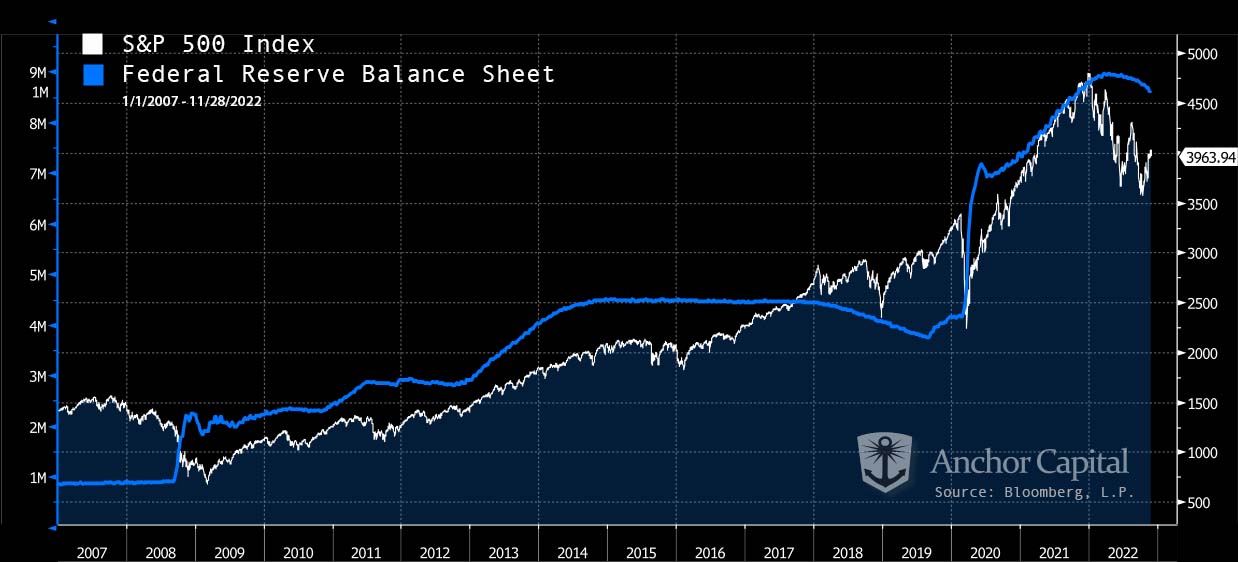
May 24, 2023In April, we highlighted the tight correlation between the size of the Federal Reserve Balance sheet and the S&P 500 Index. Generally, when the Federal Reserve adds liquidity by expanding its balance sheet through Quantitative Easing, volatility is suppressed, and asset prices generally rise. The opposite was true when the Fed paused QE or removed liquidity through Quantitative Tightening, as they did in 2018.
In the April commentary, we warned:
“Without the stability provided by Quantitative Easing, advisors should expect higher volatility ahead as the Fed not only continues to raise rates but attempts to remove liquidity through Quantitative Tightening.” Full commentary here
Right on schedule. After pausing Quantitative Easing in March, the Federal Reserve began removing $47.5 billion in liquidity in June, increasing to $95 billion per month in September. The chart below illustrates the tight correlation between Federal Reserve’s balance sheet (blue) and equities, referenced by the S&P 500 Index. (white).
Comparing the Federal Reserve Balance Sheet with the S&P 500

Investor Pivot.
The message is clear: When the Fed is engaged in Quantitative Tightening, investors should consider their own pivot to investment strategies designed to reduce volatility and hedge against market declines.
Anchor Capital offers a suite of risk-managed investment strategies and mutual funds designed to diversify portfolios and harvest opportunity- even in volatile bear markets.
Click here to learn more about Our Solutions.
