
Clear Skies
October 23, 2013The QE Experiment: What Now?
October 20, 2014April is off to a rough start for equity investors as the S&P 500 Index declined more than -3% through the week ended April 11th. The more volatile NASDAQ 100 fell more than -4%. Its been popular to blame the decline on “Tax Selling”, the practice of selling last year’s big winners to pay capital gains tax. The assumption is that after a big year for stocks like 2013, equity markets suffer higher levels of selling the following April through the 15th as investors are forced to sell a portion of last year’s winners to pay Uncle Sam.
Should we be concerned about the recent declines or is it as simple as the popular April 15th Tax selling theory? We did a little digging into the past to see if we can confirm the tax selling theory.
Is April the "Most Interesting Month of the Year?"
If Dos Equis actor Jonathan Goldsmith is "The Most Interesting Man in De World", then April has to be The Most Interesting Month of the Year. For starters, April is one of the best performing months in the calendar for stocks. Since 1915 the Dow Jones Industrial Average has averaged a gain of +1.2% in April, the Dow’s third best performing month behind July (+1.5%) and December (+1.4%). In modern markets (post 1969), April is even stronger for the S&P 500 Index1 averaging +1.3% for April, second behind the number one performing month of December (+1.7%).
The fact that April is such a historically strong month makes this theory of early month weakness caused by tax selling even more interesting.
They say the only two certain things in life are death and taxes. If the market declines of the past several weeks are a result of taxes due from outsized gains last year, we should see examples of this in the past; years of strong stock market performance followed by market declines in the first half of April. There are several examples that seem to line up with this theory. The poster child being the 1999 rally where the S&P 500 gains of +19.5% are followed by a -9.4% during the first half of April 2000.
Here are more examples of the Tax Selling Theory in action:
These examples seem to agree with the idea that a strong stock market always leads to tax selling in the first weeks of the following April. However there are other examples that argue for randomness. Who can forget the amazing gains in 1997 when the S&P 500 Index gained +31%, one of the strongest annual returns on record? Certainly there should be strong declines from tax selling the following April. Instead, the S&P actually advances +1.6% the following April through the 15th. No tax selling to be seen. In fact some of the strongest annual returns on record did not result in early April declines the following year.
Examples:
When looking at a larger data set on the S&P 500 Index going back to 1969, there are just as many examples of markets advancing during tax selling season after a strong year as there are declining.
The Two Aprils
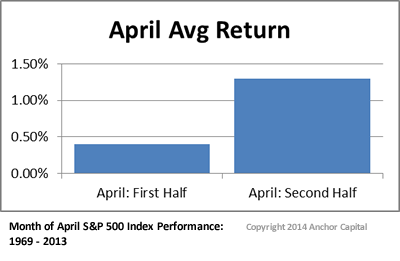
How can April consistently be one of the strongest months of the year with such pressure in the first half of the month? A deeper look at average market performance in April illustrates a general tendency for weakness in the first half- regardless of prior year performance, followed by exceptional strength in the second half through the first trading day of May. The chart below illustrates the wide divergence in risk and return between the two halves of April.
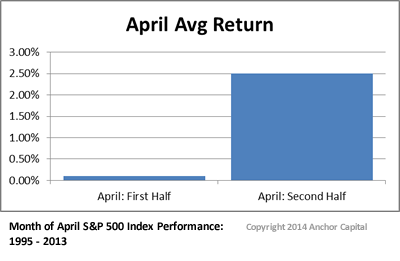
While the divergence in performance between the two Aprils is consistent over the long term, it becomes even more pronounced in modern markets. Here is the same data over just the past 20 years.
S&P 500 Index April Performance since 1995.
Since 1995 there have only been 4 years where the second half of April did not experience a rally, averaging +2.5% from April 15th. If we isolate just those years where the first half of April is negative, that average gain from April 15th through May 1 increases to +3.5%.
Selling the Good News
Our study illustrates that a pattern of early April weakness followed by late month strength is consistent for decades and seems to have little influence from prior year equity market performance. Given these historical patterns, the early April selling over the past several weeks seems reasonable.
However, the recent price behavior of equity indexes has raised a short term warning flags in our risk models. Since late March we have witnessed market participants using higher prices in the morning to liquidate large volumes of capital throughout the day in stocks that have been the strongest performers. Many of these days are on heavy volume indicating large institutional investors are exiting, despite recent positive news on the economy.
When good news results in large selling in leadership stocks, we pay attention. This type of price action often shows up as an early warning that demand for equities is thinning. It does not always mean a bear market is imminent, but it bears watching.
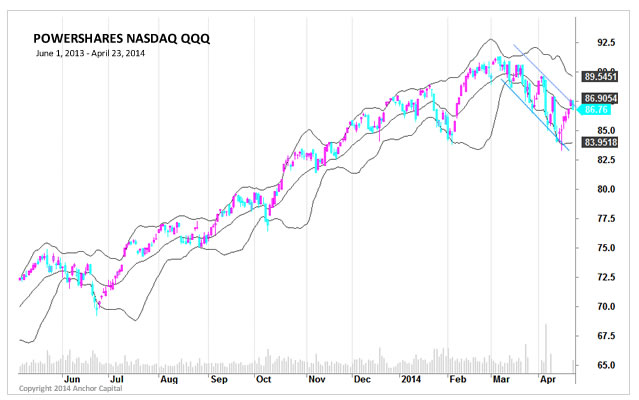
So far the equity market declines have been orderly, making a series of lower lows and lower highs in a well defined price channel. The chart below of PowerShares QQQ NASDAQ 100 Index is a good example. A breakout of either the upper or lower channel bears watching.
Cross Road
Our study of investor behavior in April shows there is a lot of opportunity in the month, but the broad equity market is at an important short term cross road. Armed with the knowledge that the second half of April is historically a bullish period (even more so after suffering a short term decline) our expectation is for higher prices ahead at least into early May. If the market fails to rally from here then the recent pattern of institutional selling into strength may be an indication of something a bit more ominous in the coming weeks. Either way, its getting "interesting."